Bob talks
Bob Stuart, creator of MQA, talks in detail about this revolutionary British technology that sets a new standard in capturing, delivering and reproducing digital audio.
MQA CD: #2 Some examples
When the transmission is restricted to 16 bits, as for example in an MQA CD, the decoder will maintain the output resolution at 24b, firstly to preserve the encoder’s enhanced quantisation, but also because there is more information in a decoded MQA CD than can be represented in a normal rectangular 44.4 kHz/16b PCM channel.
The MQA decoder maintains 24-bit precision, but the 16b restriction means the underlying channel noise (but not necessarily the recording noise) can be higher, as shown in the following illustrative examples.
 |
 |
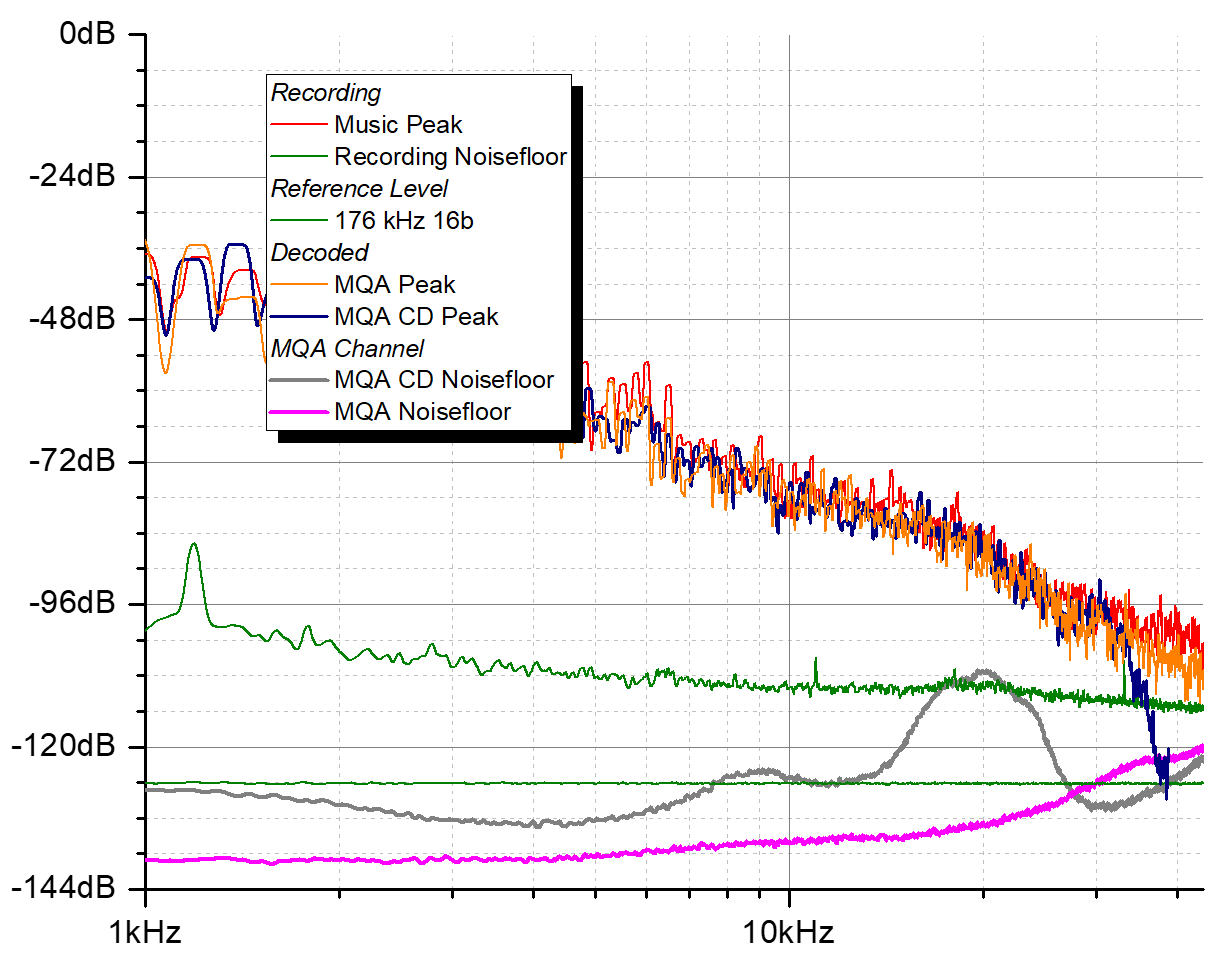 |
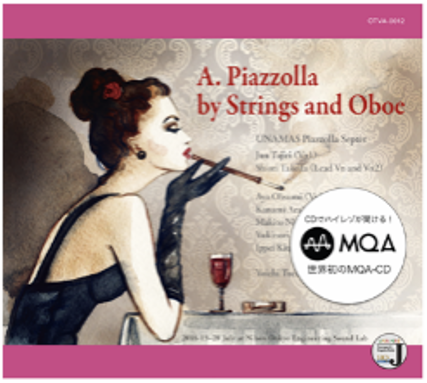
The graph illustrates a track from Piazzola by Strings and Oboe, an MQA CD from Ottava. The diagram shows us that decoding the 24-bit MQA file provides signal and noise levels that are indistinguishable from the original. On this CD, the encoding permitted band ‘B1’ to be accessible in the 16-bit replay. We can see that the MQA-CD maintains signal output up to around 36 kHz and keeps the channel noise well below the noise-floor of the recording. A big benefit is that playback benefits from substantially improved temporal response than a normal CD. |
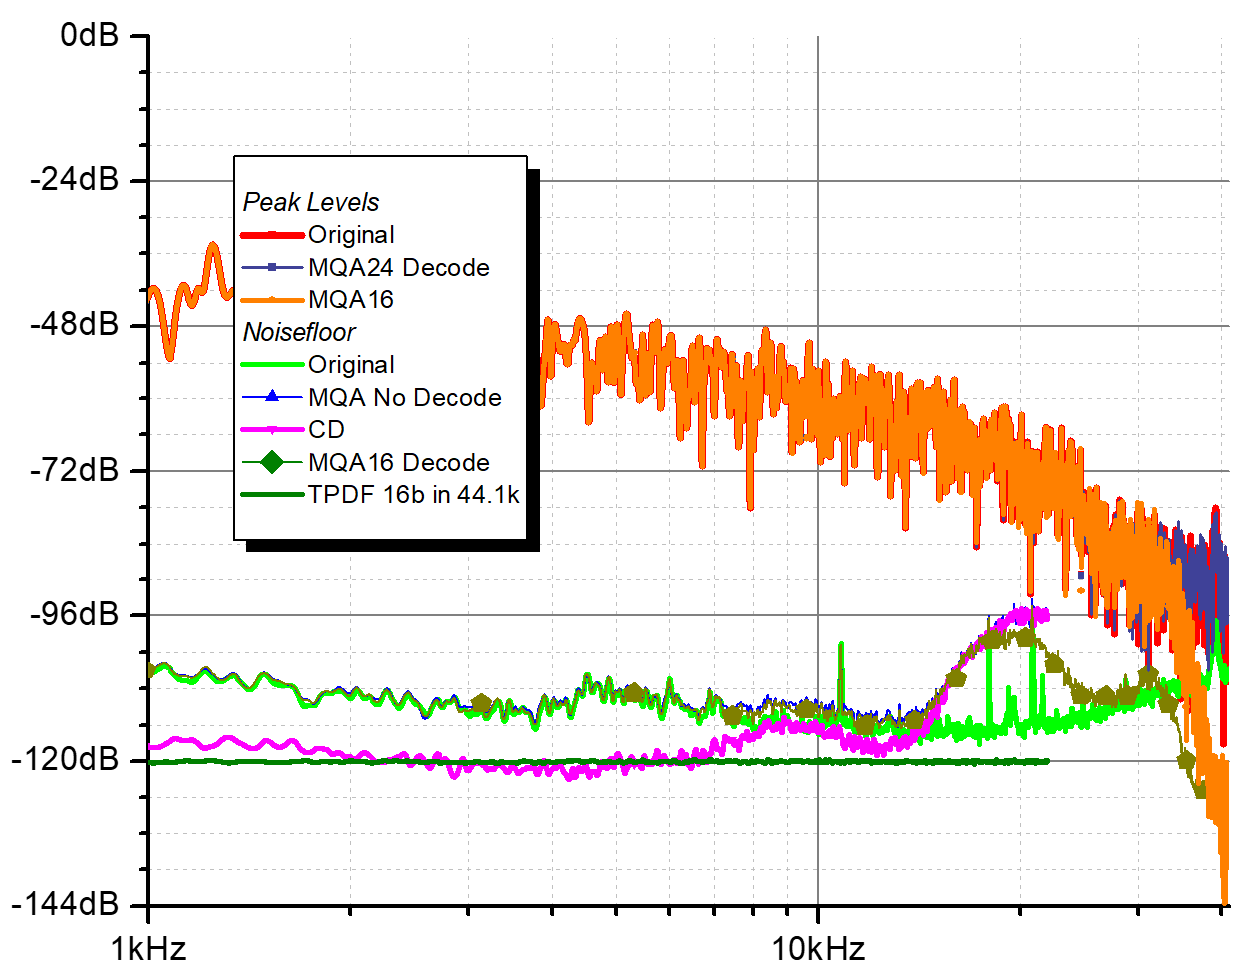 |
The graph shows an analysis of a decode of ‘The Raven’ from an MQA-CD by Rebecca Pidgeon. This encoding also permitted band ‘B1’ to be accessible in the 16-bit replay. Once again, we see information preserved above 34 kHz and in-band noise well below that of the recording and lower than conventional CD noise. |
| The next two diagrams (below) show an analysis of a recording made in DSD128. | In both the grey-shaded rectangle is the equivalent coding space for compact disc. |
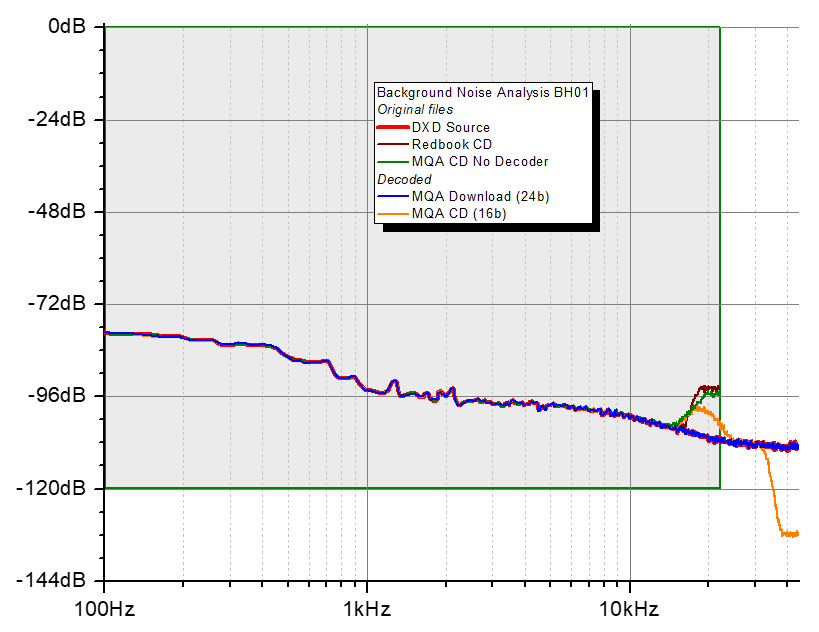 |
The left diagram shows the noise-floor in the recording for: (red) the original DSD/DXD source; (wine) a Redbook CD version; (green) for an MQA-CD played back with no decoder; (orange) for an MQA-CD with a decoder. Finally (blue) shows the noise floor of the decoded MQA 24b download file. |
| We can see above that the MQA process has not impacted the noisefloor of the recording. | We can also see that the MQA-CD has a lower noise floor than the Redbook CD and that it is reproducing higher than 35 kHz. |
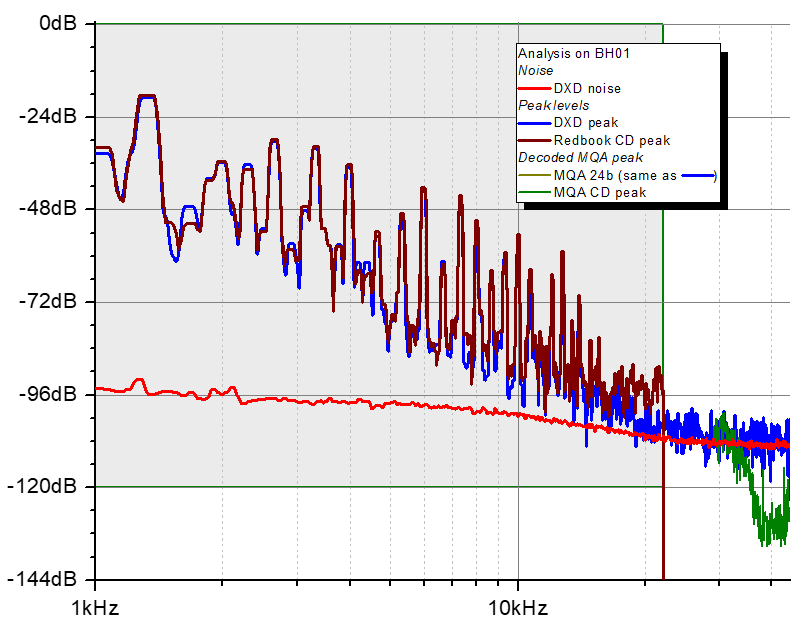 |
This diagram focuses on the loudest section of the music (note here the frequency range starts at 1kHz for clarity. (Blue) shows the peak level of the original and (olive) for the decoded MQA 24b download file – these two curves overlay. (Wine) is the peak level for the Redbook CD – we can clearly see the ‘brickwall’ drop-off at 22 kHz. (Green) is the peak level for the decoded MQA-CD, also showing that it is reproducing up to 35 kHz, which is an important region for this recording. This encoding permitted band ‘B1’ to be accessible in the 16-bit replay. |
Index
MQA CD: #1 Origami and the Last Mile