Bob talks
Bob Stuart, creator of MQA, talks in detail about this revolutionary British technology that sets a new standard in capturing, delivering and reproducing digital audio.
Appendix 3: The Musical Triangle
In the previous appendix, we showed the envelope of peak levels in high-resolution music releases. What about the noise in the recordings?
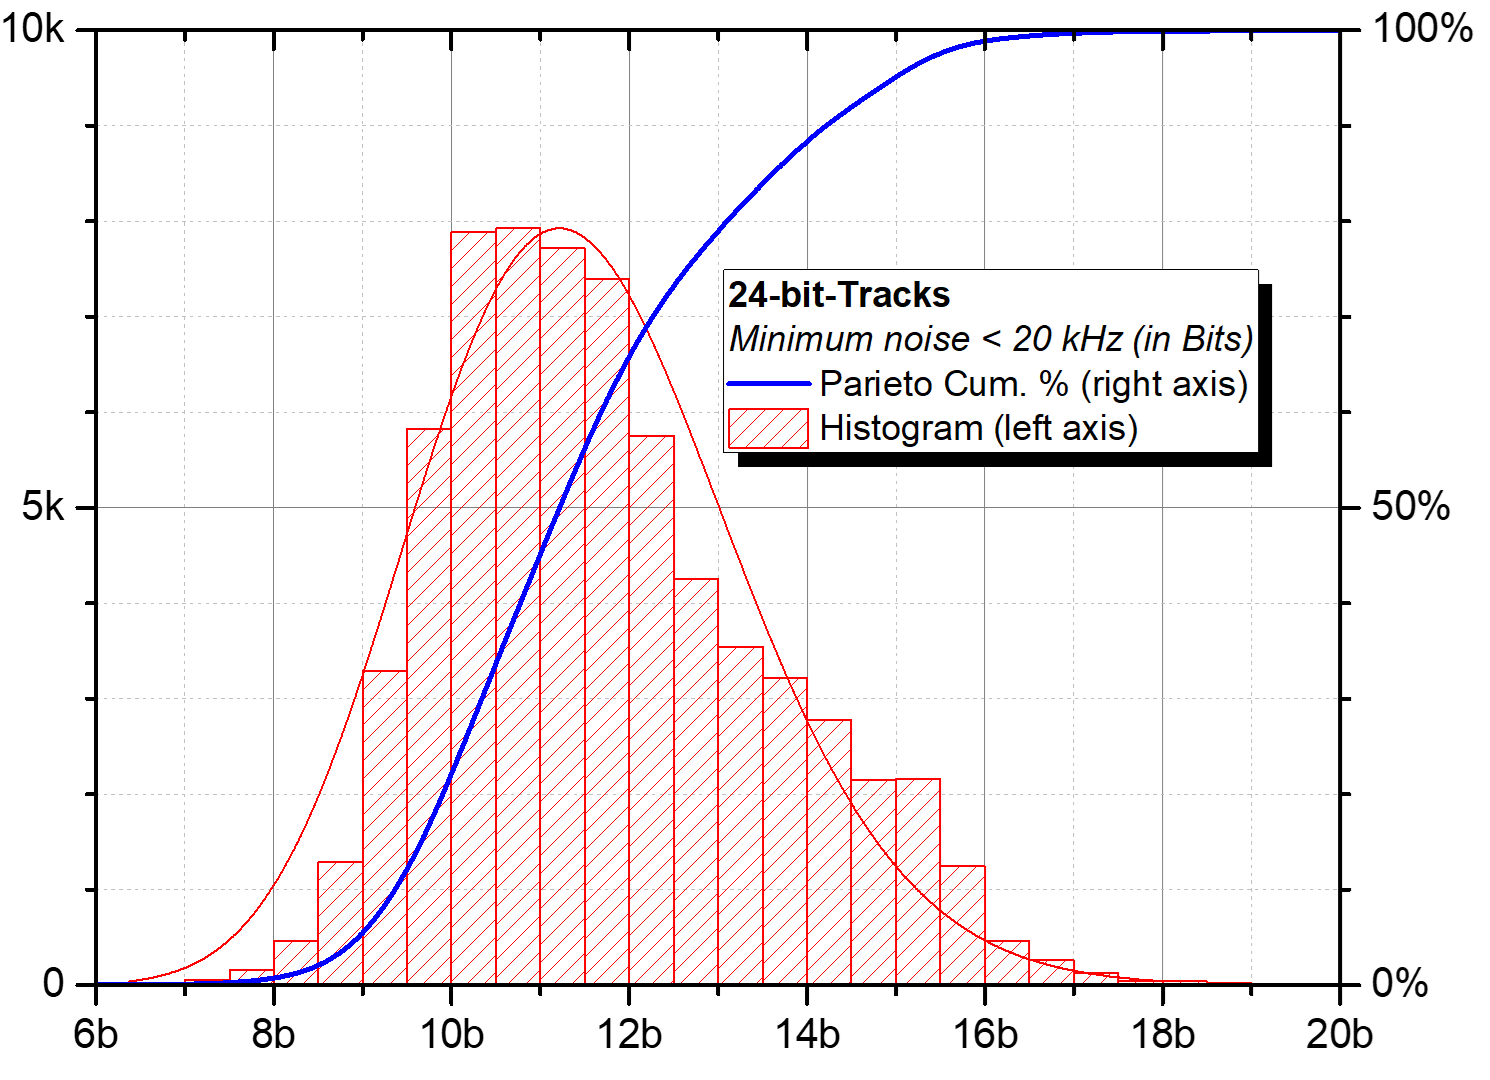
| The graph opposite is from [1] showing our analysis of the minimum noise level in the audio band for a very large number of high-resolution recordings. Note that very few have noise at or below the 16th bit and the median is at 11.5 bits. The noise-floor defines the bottom end of the dynamic range. |
 |
Every individual music recording has its own peak spectrum and a noise floor.
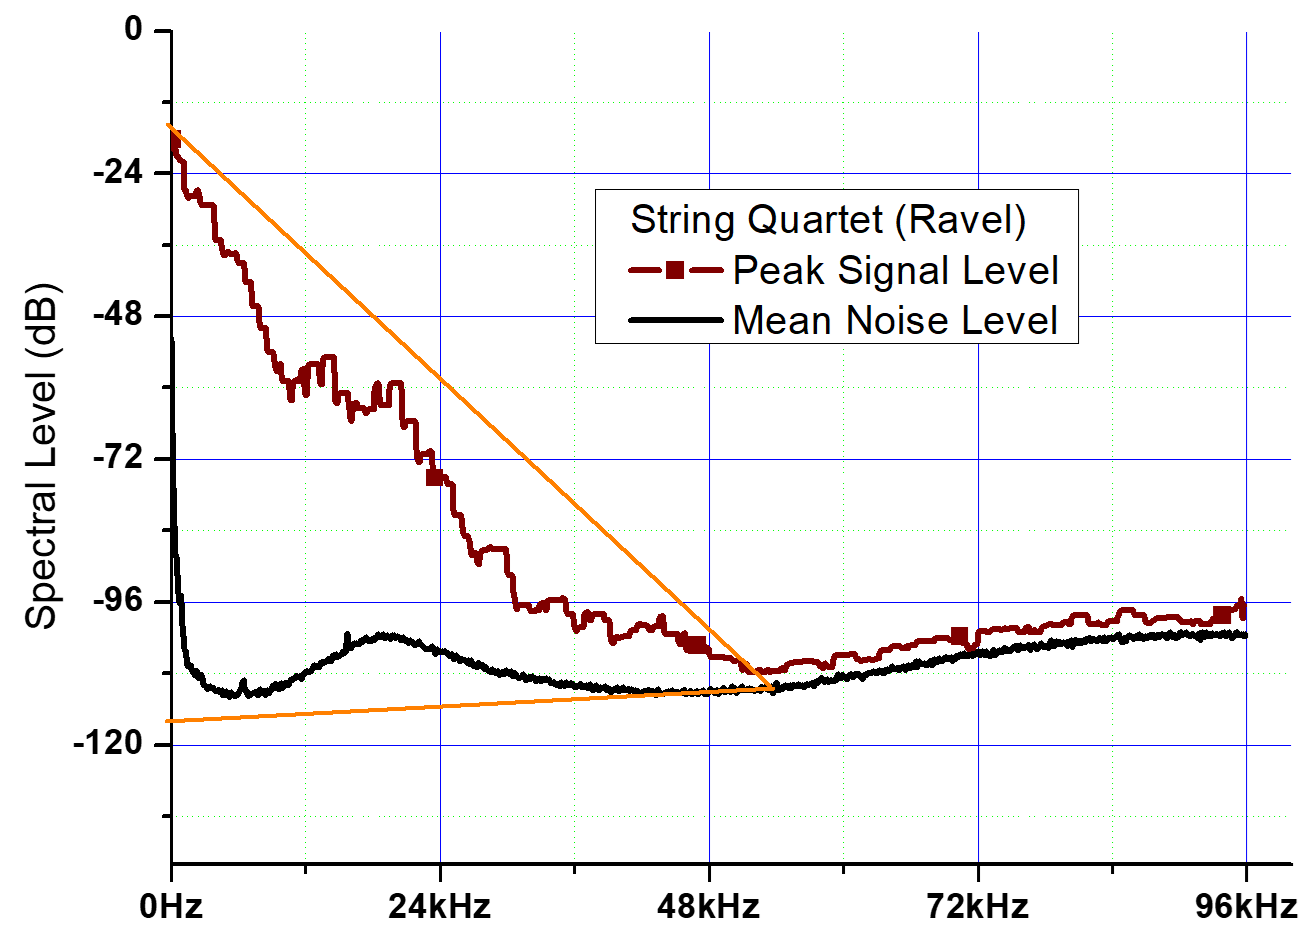
MQA has published diagrams showing how the noise-floor and peak level for individual pieces of normal music recordings can be enclosed by a triangle in a Shannon diagram (that plots dB vs linear frequency). This is possible because, at some point, the natural decline of high-frequency content falls below the noise floor in the recording. Some examples are shown below.
 |
 |
In such a graph, the enclosed area is proportional to data rate. Each graph encloses the data capacity of the source container (in these examples 192 kHz/24b == 9.22 Mbps). The area in the triangle above 24 kHz corresponds to the amount of information to be hidden by the ‘Origami’ process below the noise. [2]
The triangle identifies the musical information within the container – this is the region that MQA identifies and encodes with very high precision.
The big benefit of the MQA approach is we can use a novel sampling method with much lower temporal smearing that matches the actual signal character.
This will be the topic of another ‘Deeper Look’, coming soon. Meanwhile, you can read more about temporal blur in [3].
Next: Appendix 4: Appendix 4: MQA Encoding those files
Footnotes
[1] Stuart, J. Robert; Craven, Peter G., ‘A Hierarchical Approach for Audio Archive and Distribution’, JAES Volume 67 Issue 5 pp. 258-277; May 2019. Open Access http://www.aes.org/e-lib/browse.cfm?elib=20456
[2] Read about the ‘Origami’ process
[3] https://www.stereophile.com/content/mqa-questions-and-answers-temporal-blur-sampled-systems
Index
All that glitters is not gold(en)
Appendix 1: A ‘Tarnished Test Signal’
Appendix 2: Test Signals and Music
Appendix 3: The Musical Triangle